Presentations began today. After each presentation, students filled out a journal entry about each presenter. These were the journal questions:
1. Did the presenter have a clear objective? (1 - 5 points )
2. What the graph useful in helping the presenter accomplish their objective? (1-5 points)
3. Did the presenter give a good presentation? (1-5 points)
4. What was most memorable or beneficial to you about the presentation?
After the conclusion of presentations, students had to answer the following four questions about linear equations:
1. Write an equation for the line that passes through the points (2, 11) and (5, 20).
2. Write and equation for the line that has a slope of 4 and y-intercept of 7.
3. Write the equation of a line that has a slope of 7 and passes through the point (2,18)
4. Write the equation of a line that has a y-intercept of (0,5) and passes through the point (4, -11)
The scribe for Friday's class is Joe.
Showing posts with label unit 4. Show all posts
Showing posts with label unit 4. Show all posts
Friday, April 4, 2008

Wednesday, April 2, 2008
Scribe Post April1, 2008
Today in class what we did was to organize 4 graphs from 1-Best 4-worst.
We had to give a class vote on the orders:
4,2,3,1 (20 people)
4,3,2,1 (5 people)
20 people got the order right.
“To prove that it’s not what you know, its what you can do” Mr. Rochester.
Format the trade line. Press control click and then you have to then go to format tredline and then go to options after click display R.
Insert a new work sheet, then you are going to make a X and Y chart. Take one of your graphs, take the information in that graph and make it into X and Y chart.
After you do that highlight the points you want to graph.
Then click on insert chart
Choose scatter plot.
Click o chart menu.
Add trend line
Go to “options”
After you are done with this which will look something like this:
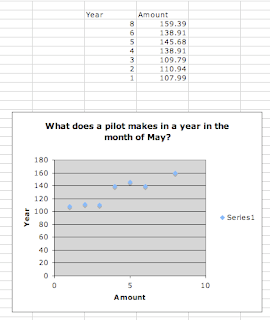 You need to tell Mr.Rochester what was your error if you had one.
Happy April Fools Day!!!!
We had to give a class vote on the orders:
4,2,3,1 (20 people)
4,3,2,1 (5 people)
20 people got the order right.
“To prove that it’s not what you know, its what you can do” Mr. Rochester.
Format the trade line. Press control click and then you have to then go to format tredline and then go to options after click display R.
Insert a new work sheet, then you are going to make a X and Y chart. Take one of your graphs, take the information in that graph and make it into X and Y chart.
After you do that highlight the points you want to graph.
Then click on insert chart
Choose scatter plot.
Click o chart menu.
Add trend line
Go to “options”
After you are done with this which will look something like this:
 You need to tell Mr.Rochester what was your error if you had one.
Happy April Fools Day!!!!
Tuesday, April 1, 2008
Scribe Post 3-27-08


Thursday, March 27, 2008

Scribe Post for Wednesday (3-26-08)
Wednesday March 26 2008
By: Lauren Mobly
Do Now
Here are the questions and answers on the Do now:
1.Explain fully what the slope and y-intercept
represent in this case.
The Y- intercepts represents the average amount a sales person made in 1998 and the total was $25,650.00. The slope represents the difference in which the total amount a sales person got paid was between 1998 and 2008.
2.Predict the value of what "y" would be given an "x"
value that is 10 units higher than your largest "x" value
in your table data.
The "Y" with a given "X" would be 48.05 if the "X"
was 20.
3.Explain what you would do to find out.
I added 20 to the formula because 20 as an "X" value
is higher than the one i have now.
4.Explain how on might judge, before collecting data, if a pair
of variables has a linear relationship.
One might judge that if they see that the variables has a
linear relationship is just simply see the pattern in the numbers
and hopefully pick them up.

By: Lauren Mobly
Do Now
Here are the questions and answers on the Do now:
1.Explain fully what the slope and y-intercept
represent in this case.
The Y- intercepts represents the average amount a sales person made in 1998 and the total was $25,650.00. The slope represents the difference in which the total amount a sales person got paid was between 1998 and 2008.
2.Predict the value of what "y" would be given an "x"
value that is 10 units higher than your largest "x" value
in your table data.
The "Y" with a given "X" would be 48.05 if the "X"
was 20.
3.Explain what you would do to find out.
I added 20 to the formula because 20 as an "X" value
is higher than the one i have now.
4.Explain how on might judge, before collecting data, if a pair
of variables has a linear relationship.
One might judge that if they see that the variables has a
linear relationship is just simply see the pattern in the numbers
and hopefully pick them up.

Tuesday, March 25, 2008
Scribe Post for Tuesday 3/25/08

Class Blog – 3/25/08 (Graphs and examples are shown on the moodle page under this date)
1) 1st we did the do now which consisted of us finding the slope of the points given on the graph. After we found the slope, we had to find the equation for the segments we made to find the slope, and afterwards we had to find the y-intercept of that line as well.
2) The second part of class we discussed Mr. Rochesters “Benchmark” the topic he chose was the Year and Income of a salesman. The data he used was –

Independent Variable = X
Dependant Variable = Y
Salary “depends on the” year
Y depends on X
Salary “is a function of” the year.
3) Further information he used is on the graph that I uploaded with this post. It shows exactly what he did on the graph he used to explain the project. The whole class was to teach us what we are going to be doing on the benchmark.
The scribe for Wednesday is Lauren

Friday, March 14, 2008
Class Scribe 3/14/08
Tajh Jenkins
Red Stream
3/14/08
Scribe
For the first part of class Mr. Rochester handed out everybody’s progress report. Now everybody is checking their missing assignments and doing or doing the journal. Other people are jus sitting around.
Red Stream
3/14/08
Scribe
For the first part of class Mr. Rochester handed out everybody’s progress report. Now everybody is checking their missing assignments and doing or doing the journal. Other people are jus sitting around.
Thursday, March 13, 2008
Thursday March 13, 2008 Algebra BARF

Today we had to complete a journal and a sketchup.
We discussed Slopes and Y-Intercepts.
March 7,2008 Scribe Post
March 7,2008 Scribe Post Qianna Nelson
On Friday what we did was turn in all missing assignments.
We had to do a journal on our projects.
• Are all of your project requirements turned in?
• Who are your group members?
• What grades should each of you receive?
You had to upload your 3 graphs, your story. We didn’t have any homework.
On Friday what we did was turn in all missing assignments.
We had to do a journal on our projects.
• Are all of your project requirements turned in?
• Who are your group members?
• What grades should each of you receive?
You had to upload your 3 graphs, your story. We didn’t have any homework.
Subscribe to:
Posts (Atom)