Presentations began today. After each presentation, students filled out a journal entry about each presenter. These were the journal questions:
1. Did the presenter have a clear objective? (1 - 5 points )
2. What the graph useful in helping the presenter accomplish their objective? (1-5 points)
3. Did the presenter give a good presentation? (1-5 points)
4. What was most memorable or beneficial to you about the presentation?
After the conclusion of presentations, students had to answer the following four questions about linear equations:
1. Write an equation for the line that passes through the points (2, 11) and (5, 20).
2. Write and equation for the line that has a slope of 4 and y-intercept of 7.
3. Write the equation of a line that has a slope of 7 and passes through the point (2,18)
4. Write the equation of a line that has a y-intercept of (0,5) and passes through the point (4, -11)
The scribe for Friday's class is Joe.
Friday, April 4, 2008
Wednesday, April 2, 2008
Scribe Post April1, 2008
Today in class what we did was to organize 4 graphs from 1-Best 4-worst.
We had to give a class vote on the orders:
4,2,3,1 (20 people)
4,3,2,1 (5 people)
20 people got the order right.
“To prove that it’s not what you know, its what you can do” Mr. Rochester.
Format the trade line. Press control click and then you have to then go to format tredline and then go to options after click display R.
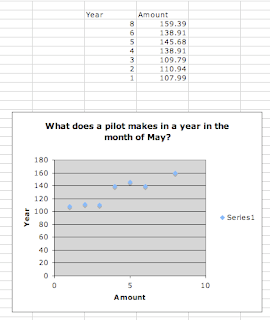
Insert a new work sheet, then you are going to make a X and Y chart. Take one of your graphs, take the information in that graph and make it into X and Y chart.
After you do that highlight the points you want to graph.
Then click on insert chart
Choose scatter plot.
Click o chart menu.
Add trend line
Go to “options”
After you are done with this which will look something like this:
 You need to tell Mr.Rochester what was your error if you had one.
Happy April Fools Day!!!!
We had to give a class vote on the orders:
4,2,3,1 (20 people)
4,3,2,1 (5 people)
20 people got the order right.
“To prove that it’s not what you know, its what you can do” Mr. Rochester.
Format the trade line. Press control click and then you have to then go to format tredline and then go to options after click display R.
Insert a new work sheet, then you are going to make a X and Y chart. Take one of your graphs, take the information in that graph and make it into X and Y chart.
After you do that highlight the points you want to graph.
Then click on insert chart
Choose scatter plot.
Click o chart menu.
Add trend line
Go to “options”
After you are done with this which will look something like this:
 You need to tell Mr.Rochester what was your error if you had one.
Happy April Fools Day!!!!
Tuesday, April 1, 2008
Scribe Post 3-27-08


Subscribe to:
Posts (Atom)